So far, I have been preparing composite figures by plotting the data using ggplot2, and then putting the panels together in OmniGraffle or Adobe Illustrator. Of course, every time the data is updated, I would need to go back to the vector editing program. After moving my manuscript from Word to knitr, I figured I should also try to cut out the image editing step.
ggplot2 does not make it easy to put different panels together in a seamless fashion and without any margins. However, by piecing together different StackOverflow answers, I found a way to extract different parts of the figures, and glue them back together with the gtable package. I can now produce a plot like this without a trip to Illustrator!
The solution is still a bit fragile, as the different dimensions of the PNG image and the rows and columns need to be adjusted manually to make it look right. Here is a minimal working example (with some superfluous steps, I'm sure):
The output of the Gist should produce this image:
Showing posts with label ggplot2. Show all posts
Showing posts with label ggplot2. Show all posts
Tuesday, March 10, 2015
Monday, April 22, 2013
2D plot with histograms for each dimension (2013 edition)
In 2009, I wrote about a way to show density plots along both dimensions of a plot. When I ran the code again to adapt it to a new project, it didn't work because ggplot2 has become better in the meantime. Below is the updated code. Using the gridExtra package and this hint from the ggplot2 wiki, we get this output:
Source code:
Source code:
Thursday, August 11, 2011
ggplot2: Determining the order in which lines are drawn
In a time series, I want to plot the values of an interesting cluster versus the background. However, if I'm not careful, ggplot will draw the items in an order determined by their name, so background items will obscure the interesting cluster:
One way to solve this is to combine the label and name columns into one column that is used to group the individual lines. In this toy example, the line belonging to group 1 should overlay the other two lines:
 |  |
| Correct: Interesting lines in front of background | Wrong: Background lines obscure interesting lines |
One way to solve this is to combine the label and name columns into one column that is used to group the individual lines. In this toy example, the line belonging to group 1 should overlay the other two lines:
Thursday, March 10, 2011
Comparing two-dimensional data sets in R; take II
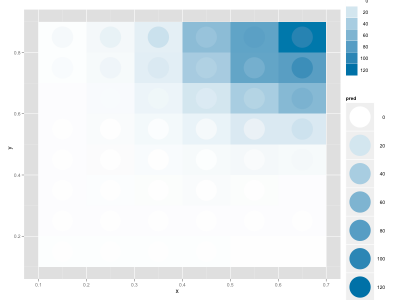
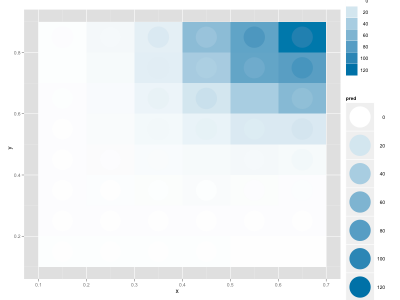
David commented on yesterday's post and suggested to put the continuous fitted distribution in the background and the discrete, empirical distribution in the foreground. This looks quite nice, although there's a slight optical illusion that makes the circles look as if they'd be filled with a gradient, even though they're uniformly colored:
 |
| Not-so-good fit |
 |
| Better fit |
Wednesday, March 9, 2011
Comparing two-dimensional data sets in R
I wanted to fit a continuous function to a discrete 2D distribution in R. I managed to do this by using nls, and wanted to display the data. I discovered a nice way to compare the actual data and the fit using ggplot2, where the background is the real data and the circles are the fitted data (the legend is not optimal, but for a slide/figure it's probably easier to fix it in Illustrator):
My data frame includes these columns: x, y, enrichment (the real data), pred (my fitted values).
 |
| A not-so-good fit |
 |
| A better fit |
My data frame includes these columns: x, y, enrichment (the real data), pred (my fitted values).
Thursday, September 3, 2009
Learning ggplot2: 2D plot with histograms for each dimension
Update (April 2013): The code below doesn't work anymore with new ggplot2 versions, here is an updated version.
I have two 2D distributions and want to show on a 2D plot how they are related, but I also want to show the histograms (actually, density plots in this case) for each dimension. Thanks to ggplot2 and a Learning R post, I have sort of managed to do what I want to have:
 There are still two problems: The overlapping labels for the bottom-right density axis, and a tiny bit of misalignment between the left side of the graphs on the left. I think that the dot in the labels for the density pushes the plot a tiny bit to the right compared with the 2D plot. Any ideas?
Here's the code (strongly based on the afore-linked post on Learning R):
I have two 2D distributions and want to show on a 2D plot how they are related, but I also want to show the histograms (actually, density plots in this case) for each dimension. Thanks to ggplot2 and a Learning R post, I have sort of managed to do what I want to have:
Here's the code (strongly based on the afore-linked post on Learning R):
p <- colour="cyl)<br" data="mtcars," geom="point" hp="" mpg="" qplot="">
p1 <- br="" legend.position="none" opts="" p="">
p2 <- aes="" colour="cyl))<br" ggplot="" group="cyl," mtcars="" x="mpg,">p2 <- br="" fill="NA," p2="" position="dodge" stat_density="">p2 <- axis.title.x="theme_blank()," br="" legend.position="none" opts="" p2="">      axis.text.x=theme_blank())

p3 <- aes="" colour="cyl))<br" ggplot="" group="cyl," mtcars="" x="hp,">p3 <- br="" coord_flip="" fill="NA," p3="" position="dodge" stat_density="">p3 <- axis.title.y="theme_blank()," br="" legend.position="none" opts="" p3="">      axis.text.y=theme_blank())

legend <- br="" keep="legend_box" opts="" p="">
## Plot Layout Setup
Layout <- grid.layout="" ncol="2,<br" nrow="2,">   widths = unit (c(2,1), c("null", "null")),
   heights = unit (c(1,2), c("null", "null"))
)
vplayout <- br="" function=""> grid.newpage()
 pushViewport(viewport(layout= Layout))
}
subplot <- function="" layout.pos.col="y)<br" layout.pos.row="x," viewport="" x="" y="">
# Plotting
vplayout()
print(p1, vp=subplot(2,1))
print(p2, vp=subplot(1,1))
print(p3, vp=subplot(2,2))
print(legend, vp=subplot(1,2))
Subscribe to:
Posts (Atom)


